Yamada performance curves plot viscosity, temperature, total head, and air pressure requirements in easy to read charts.
Source: Yamada Performance Curves – A Visual Representation of Typical Pump Performance
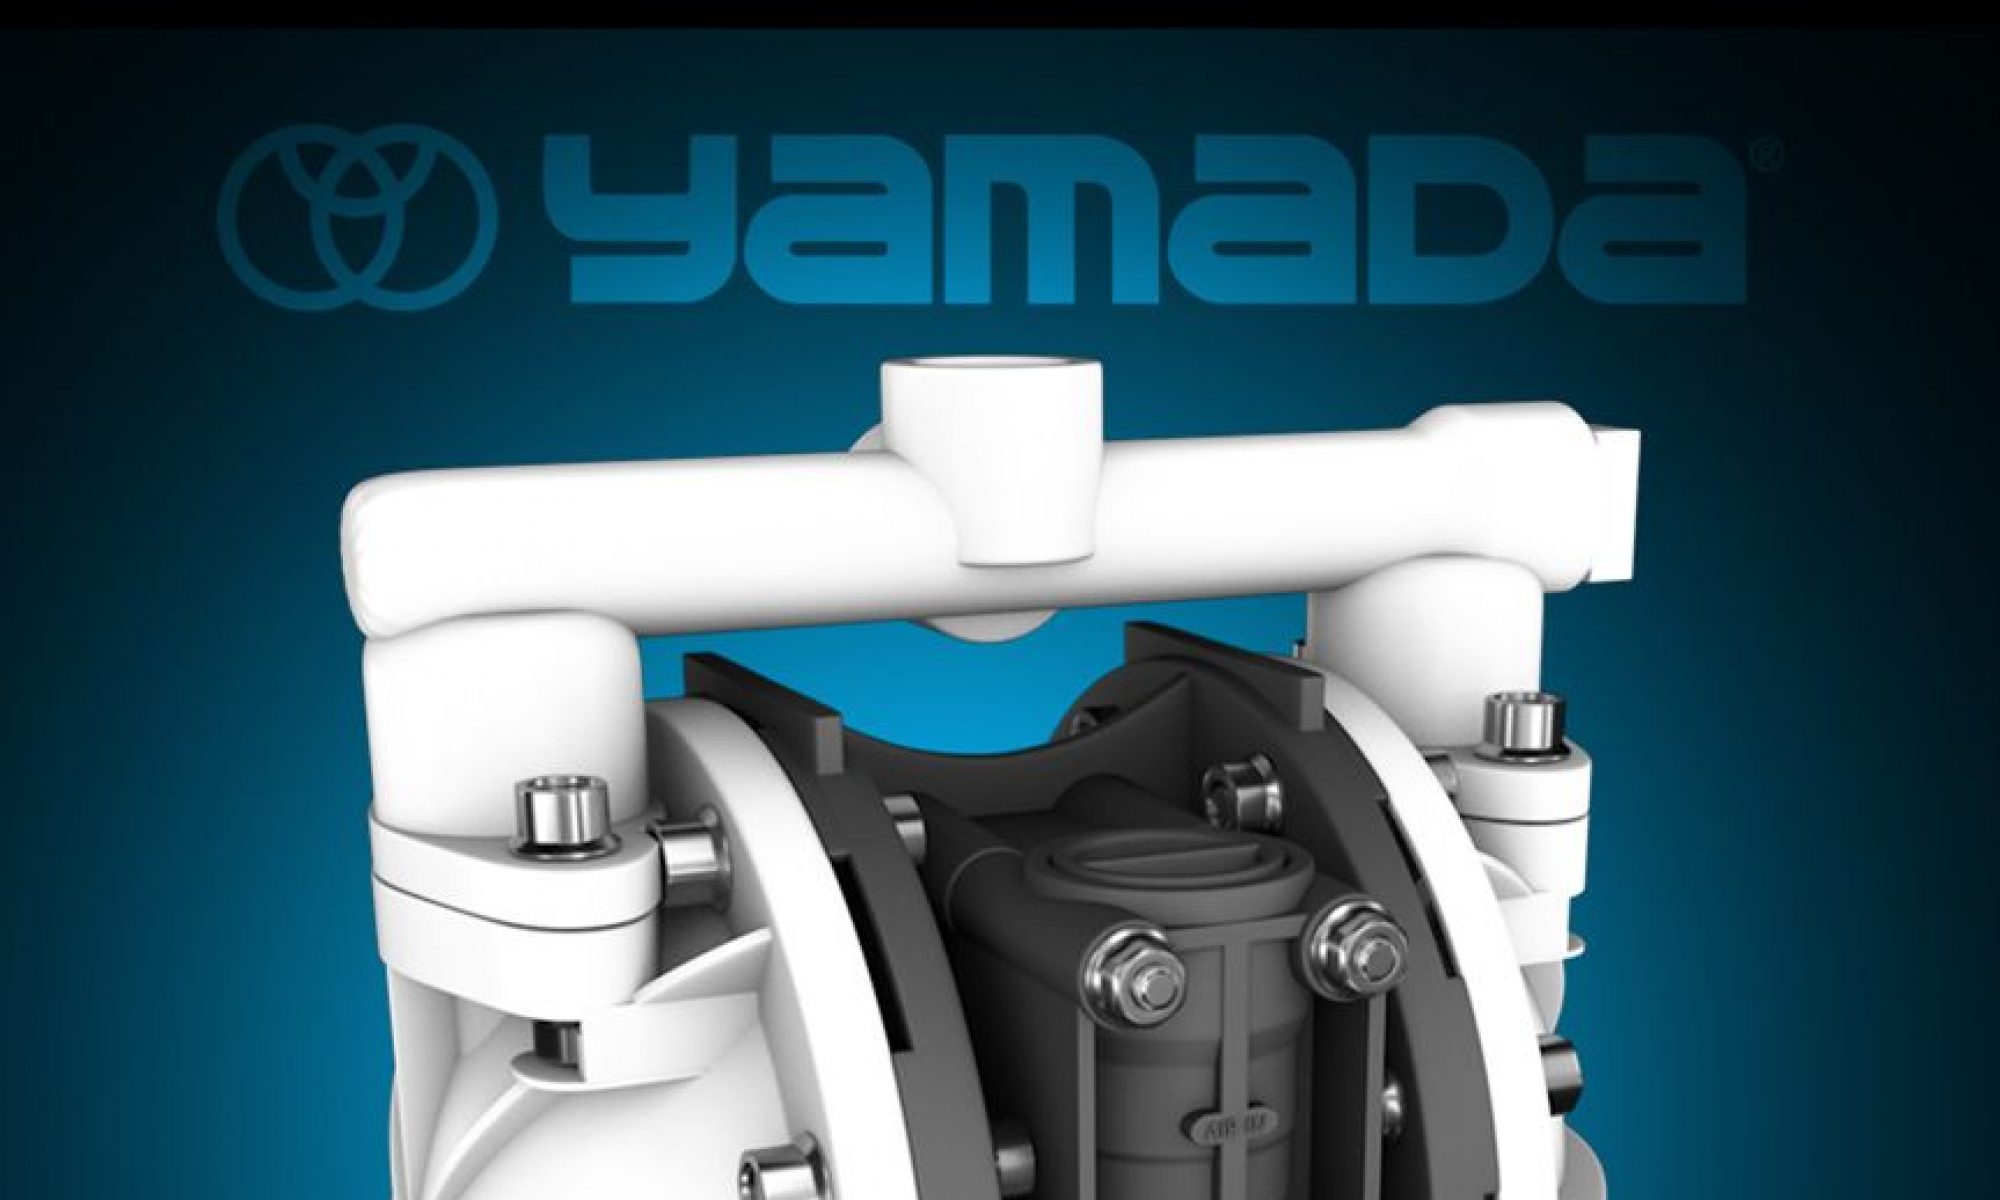
Useful information on Yamada pumps and pump accessories
Yamada performance curves plot viscosity, temperature, total head, and air pressure requirements in easy to read charts.
Source: Yamada Performance Curves – A Visual Representation of Typical Pump Performance